
Viewpoint on ISA TR84.0.02 – Simplified Methods and Fault Tree Analysis
Angela E. Summers, Ph.D., P.E.
President, SIS-TECH Solutions, LLC
PMB-295, 2323 Clear Lake City Blvd Houston, Texas 77062-8032
713-320-4777 (phone)
§ 281-461-8109 (fax) www.SIS-TECH.com
Accepted for publication in ISA Transactions
Abstract
ANSI/ISA-S84.01-1996 and IEC 61508 require the establishment of a safety integrity level for any safety instrumented system or safety related system used to mitigate risk. Each stage of design, operation, maintenance, and testing is judged against this safety integrity level. Quantitative techniques can be used to verify whether the safety integrity level is met. ISA-dTR84.0.02 is a technical report under development by ISA, which discusses how to apply quantitative analysis techniques to safety instrumented systems. This paper discusses two of those techniques: 1) simplified equations and 2)fault tree analysis.
Introduction
In 1996, ISA, the international society for measurement and control, voted unanimously for the approval of ISA-S84.01. In 1997, the standard was accepted by the American National Standards Institute (ANSI) and is now known as ANSI/ISA-S84.01-1996 (1). This standard is considered by the U.S. Environmental Protection Agency (EPA) and Occupational Safety and Health Administration (OSHA) as a generally accepted good industry practice (2,3). Any U.S. based instrumented systems specified after March 1997 should be designed in compliance with this standard.
Internationally, IEC 61508, "Functional Safety of Electronical/Electronic/Programmable Electronic (E/E/PES) Safety-Related Systems," (4,5) is getting very close to being released as a final standard. The standard consists of seven parts, four of which have already been issued as final and three are waiting for final vote on the final draft international standard. The intent is to release the entire standard as final in early 2000. Instrumented systems designed in the next millennium must comply with this standard with the exception of U.S. installations that must follow ANSI/ISA-S84.01-1996.
Both standards are performance-based and contain very few prescriptive requirements. The "performance" of the safety instrumented system (SIS) is based on a target safety integrity level (SIL) that is defined during the safety requirements specification development (6). According to thestandards, the ability of the SIS to achieve a specific SIL must be validated at each stage of design and prior to any change made to the design after commissioning. The entire operation, testing, and maintenance procedures and practices are also judged for agreement with the target SIL. Thus, the successful implementation of a validation process for SIL is very important for compliance with either standard.
The SP84 committee is working to complete a technical report, ISA-dTR84.0.02, which will discuss three techniques for the quantification of SIL. These methods are Simplified Equations (8), Fault Tree Analysis (9), and Markov Modeling (11). The technical report introductory material states that the purpose of dTR84.0.02 is to provide supplemental information that would assist the User in evaluating the capability of any given SIS design to achieve its required SIL and to reinforce the concept of the performance based evaluation of SIS. The technical report further states that the quantification of the SIL is performed to ensure that the SIS meets the SIL required for each safety function, to understand the interactions of all the safety functions, and to understand the impact of failure of each component in the SIS. Therefore, the technical report emphasizes the importance of evaluating the SIS design (7).
The technical report also acknowledges the importance of spurious trip rate to the operation of the facility. Spurious trips are often not without incident. There is a process disruption; alarms sound; and PRVs lift causing flares many meters high. Consequently, the technical report presents the mathematics involved in determining the spurious trip rate. When viewing the calculations presented and interpreting the results, it is important to understand that the spurious trip rate is a frequency with the units of failures per unit of time and the SIL is a probability, i.e., a dimensionless number.
ISA-dTR84.0.02 presents three quantitative methods: 1) Simplified Equations, 2) Fault Tree Analysis, and 3) Markov modeling. The technical report is not a comprehensive textbook or treatise on any of the methods. All of the parts assume that the User of the technical report has a basic understanding of probabilistic theory and the method being presented. It also assumes that the User knows how to obtain and evaluate the appropriateness of the data for a specific application. The intent of the technical report is to provide guidance on how to apply this knowledge to safety instrumented systems.
Many Users will choose to use Simplified Equations for an initial estimation of the PFDavg for various design options. It may also be used to evaluate SIL 1 and SIL 2 systems where the architecture is sufficiently simple for the hand calculations. For SIL 3 systems, the complexity of the design often makes the Simplified Equations not so simple to use. Therefore, the technical report recommends the use of Simplified Equations for "simple SISs."
For more complex SISs, Fault Tree Analysis or Markov modeling is recommended. Fault Tree Analysis is widely used by the general risk assessment industry for defining the frequency or probability of particular incident scenarios. The calculations can be done by hand, but since computer software models are readily available, most Fault Tree Analysis is performed using a computer program.
Many risk analysts are not familiar with Markov modeling and the fundamental math behind the method will be a rude awakening to those Users who have forgotten how to do matrix math or how to solve Laplace Transforms. However, Markov modeling should be used for the evaluation of any programmable logic solver (11), since Markov modeling can take into account time dependent failures and variable repair rates found in most TUV Class 5 and 6 certified logic solvers. It is best to leave the Markov modeling to the Vendor and ask the Vendor for the PFDavg at the anticipated logic solver testing frequency. Users should focus instead on learning how to apply Simplified Equations and Fault Tree Analysis to evaluate the field design, including the input and output devices and support systems.
Determining SIL of a SIS via Simplified Equations (8)
The Simplified Equation technique involves determining the PFDavg for the field sensors (FS), logic solver (LS), final elements (FE), and support systems (SS). The field sensors are the inputs required to detect the hazardous condition. The logic solver accepts these inputs and generates correct outputs that change the state of the final elements in order to mitigate the hazardous condition. The support systems are those systems that are required for successful functioning of the SIS. If the valves are air-to- move, the instrument air supply must be analyzed. If the SIS is energize-to-trip, the power supply must be considered as part of the SIS. Once the individual PFDs for each input, logic solver, output and support system are known, these PFDs are summed for the PFDSIS.
![]()
The Simplified Equations used for calculating the PFDavg were initially derived from Markov Models, however the simplification of the models resulted in some limitations. Unlike Markov Models, this method does not handle time dependent failures or sequence dependent failures. Due to these limitations, this method should not be used to analyze programmable logic solvers.
Part 2 includes equations for 1oo1, 1oo2, 1oo3, 2oo2, 2oo3, and 2oo4 architectures. These equations have been derived from Markov models, assuming the rare event approximation. The rare event approximation can only be used when the failure rate (l) multiplied by the testing interval (TI) is much smaller than 0.1. This can be stated mathematically as lTI << 0.1. Simplified Equations results in the calculation of the PFDavg for each voting configuration. The extended equations do include some variables for which published data is not available. These variables must be estimated from experience. Consequently, an experienced risk analyst and/or engineer is required for correct estimation of these variables. For instance, the equation for 1oo2 architecture is as follows:

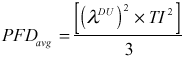
The first term is the undetected dangerous failure of the SIS. It shows the effect that the device undetected dangerous failure rate (lDU ) and testing interval (TI) have on the PFDavg. This is the term of the most important part of this equation in determining the unavailability of the SIS. This term is actually simplified from the full Markov solution.
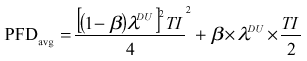
In explanation, the beta (b) factor method is a technique that can be used to estimate common cause failure effects on the SIS design. The b factor is estimated as a percentage of the failure rate of one of the devices in a redundant configuration, assuming both devices have the same failure rate (note third term above). Therefore, the common cause failure rate or dependent failure rate would be b*lDU and the device failure rate or independent failure rate would be (1-b)* lDU. For the purposes of Part 2, (1-b) was considered to be equal to 1, yielding conservative results. For large b factors, (1-b) should be considered, which would yield the following equation for a 1oo2 architecture:

The published data in OREDA (12), CCPS (13), and RAC (14) sometimes provide the undetected dangerous failure rate; however, many times, only a total dangerous failure rate is published. If only the total dangerous failures are known, the User must make an assumption concerning the percentage of the total dangerous failures that can be detected with diagnostics. If the percentage is not known, the total dangerous failures can be used to obtain a conservative estimate of the PFDavg.
The second term is the probability of having a second undetected failure (l DU ) during the repair of a detected failure (l DD ). This numerical value of this term is generally very small, since the repair time (MTTR) is typically less than 24 hours. Consequently, this term often can be considered negligible.
The third term represents the probability of common cause failure based on the beta factor method. The beta factor must be estimated by the User, since there is almost no published data available for current technology. The technical report states that the value is somewhere between 0 and 20%. Many Users have determined that with proper design practices (15) that a beta factor in the range of 0.1 to 2% can be used. The beta factor has a profound effect on the PFDavg obtained for redundant architectures, so it must be selected carefully. For initial comparisons of architecture and testing frequency, it is best to assume that this term is negligible. Effective design can minimize common cause failure. However, if an analysis of the design indicates that common cause failures can occur, such as shared process taps or a shared orifice plate, a beta factor should be selected and included in the final calculation.
The fourth term is the probability of systematic failure. Systematic failures are those failures that result due to design and implementation errors. Systematic failures are not related to the hardware failure. Examples of systematic failures are as follows:
- SIS design errors
- Hardware implementation errors
- Software errors
- Human interaction errors
- Hardware design errors
- Modification errors
The systematic failure rate (l DF) is extremely difficult to estimate. Also, many of the listed systematic failures will affect all of the architectures equally. If software design is poor, it does not matter whether there is one, two or three transmitters. This term also assumes that the systematic failures can be diagnosed through testing. Therefore, effective design, independent reviews, and thorough testing processes must be implemented to minimize the probability of systematic failures. When good engineering design practices are utilized, these failures can be considered negligible.
Based on the repair time being short and on the common cause and systematic failures being minimized through good design practices, these terms can be neglected yielding the following equation:
Similar reduced equations are provided for 1oo1, 1oo2, 1oo3, 2oo2, 2oo3, and 2oo4 architectures.
Determining Spurious Trip Rate via Simplified Equations
For the spurious trip rate, the full equation for 1oo2 is as follows:
![]()
The first term contains the failures associated with a device experiencing either a dangerous detected failure which forces the logic to the trip state or a safe failure. Due to spurious trip concerns, many Users choose to fail a detected device failure "away" from the trip. This converts the logic to 1oo1 for the remaining device until repair is initiated. If this type of logic is utilized, the dangerous detected failure rate contribution to the spurious failure rate can be assumed to be zero.
The second term is the common cause term and the third term is the systematic failure rate. Effective design and good engineering techniques should minimize both of these terms. The equation can then be reduced to the following:
![]()
Similar reduced equations can be derived for the other architectures.
When STR is known for each combination of field sensors, logic solver, final element, and support systems. The overall STR is calculated by summing the individual STRs. The final answer is the frequency at which the SIS is expected to experience a spurious trip.
Limitations of The Simplified Equations Methodology
The published equations in ISA-dTR84.0.02 do not allow the modeling of diverse technologies. The sensors or final elements used in each voting strategy must have the same failure rate. Consequently, this method does not allow the modeling of a switch and a transmitter or a control valve and a block valve. During the derivation for the equations in Part 2 and those shown in Part 5, it was assumed that the failure rate of voted devices were the same. It must be emphasized that this is a limitation of the equations presented in these parts. It is not a limitation of the mathematics of the methodology.
However, a significant limitation of the mathematics is the requirement that the testing frequency be the same for all voted devices. To perform the Markov model derivation, the integration is performed over the range of time 0 to time "testing frequency." Consequently all devices in a voted set must be tested at the same interval.
The method also does not allow the modeling of any SIS device interactions or complex failure logic, such as 1oo2 temperature sensors detecting the same potential event as 2oo3 pressure sensors. The actual failure logic may be that the event will not occur unless both temperature sensors and 2oo3 pressure sensors fail. This method will only look at the sensor failures as separate issues. Consequently, this method is used to model simple SISs only. However, the math is easy and all this method requires for execution is a pad of paper and a pen (or computer).
Determining SIL of a SIS via Fault Tree Analysis (9)
Part 3 discusses the use of fault trees analysis for modeling the SIS. Fault tree symbols are used to show the failure logic of the SIS. The graphical technique of Fault Tree Analysis allows easy visualization of failure paths. Since the actual failure logic is modeled, diverse technologies, complex voting strategies, and interdependent relationships can be evaluated. However, Fault Tree Analysis is not readily adaptable to SISs that have time dependent failures. As with Simplified Equations, Fault Tree Analysis is not recommended for modeling programmable logic solvers. The User should obtain the PFDavg for the logic solver from the Vendor at the anticipated logic solver testing frequency.
Fault Tree Analysis is one of the most common techniques applied for quantifying risk in the process industry. Computer programs, books, and courses are available to the User to learn how to apply Fault Tree Analysis. The technical report recommends the use of Fault Tree Analysis in SIL 2 and SIL 3 SIS applications. It does require more training and experience than the Simplified Equations, but will yield more precise results.
The mathematical approach for Fault Tree Analysis is different from Markov model analysis. Fault Tree Analysis assumes that the failures of redundant devices are independent and unconditional. In Fault Tree Analysis, the PFDavg is calculated for each device and then Boolean algebra is used to account for the architecture and voting. Consequently, the equations used for some architectures will be different when Simplified Equations are used rather than Fault Tree Analysis. When the equations are different, of course, the PFDavg value will differ. However, both methods provide acceptable approximations of the PFDavg for the SIS.
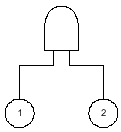
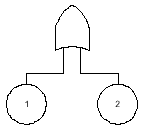
A Fault Tree Analysis begins with a graphical representation of the SIS failure. For example, in the 1oo2 voting of two identical devices, the fault tree would look as shown in Figure 1. The failure of the SIS would only occur if both device 1 and device 2 failed. The and gate is used to illustrate this logic.
Figure 1. Fault Tree for PFDavg for 1oo2 Voting Devices
The data would be collected and used to calculate the PFDavg of each device
![]()
Boolean algebra, also known as cut-set math, is used to calculate the and gate. This yields:
![]()
Since these calculations are based on the PFDavg for a single device, it is easy to examine cases where the failure rates and testing frequencies of the two devices are not the same. The PFDavg for each event is simply calculated based on its failure rate and testing frequency. These PFDavg values are combined using the cut-set math.
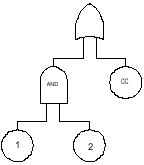
Any of the terms discussed in the Simplified Equations overview can be included in the fault tree as events, such as systematic failure and common cause failure. The 1oo2 voting devices, including common cause, would appear as shown in Figure 2.
Figure 2. PFDavg for 1oo2 Voting Devices With Common Cause Consideration
The independent failure rate contribution would be calculated as follows:
![]()
The common cause contribution to the PFDavg would be calculated as follows:
![]()
The common cause failure contribution can then be added to the independent failure rate contribution using cut-set math. For rare events, the PFDavg calculations would be as follows:
The systematic failure contribution to the PFDavg can be added in a similar fashion.
Determining The Spurious Trip Rate via Fault Tree Analysis
For the spurious trip rate calculation, the same graphical technique is used, as well as the same cut-set mathematics. However, the equations used to describe the individual events are based on frequencies not probabilities. For the 1oo2 voting devices, the fault tree is drawn as shown in Figure 3.
Figure 3: Fault tree for Spurious Trip for 1oo2 Voting Devices
The spurious trip rate is calculated as follows:
![]()
Limitations of The Methodology
The derivation methodology for fault tree analysis is different from the Markov derivation methodology used in the other parts of TR84. While not truly a limitation of the methodology, the difference in the PFDavg values for some architectures has resulted in disagreement among TR84 members about the true definition of PFDavg . However, the difference in the overall results is seldom significant, but the reader is warned that there will be instances where simplified equations and fault tree analysis will not yield identical results.
There are three principle benefits associated with using Fault Tree Analysis for SIL verification. First, the graphical representation of the failure logic is easily understood by risk analysts, engineers, and project managers. Second, the method has been used by the process industry for risk assessment for many years, so there is already a resource base within many User companies, as well as outside consultants. Finally, the availability of software tools to facilitate the calculations improves the quality and precision of the calculation.
Conclusions
ISA-dTR84.0.02 is intended to provide guidance on how to calculate the SIL of a SIS. Since ISA-dTR84.0.02 is a guidance document, there are no mandatory requirements. The document was not developed to be a comprehensive treatise on any of the methodologies, but was intended to provide assistance on how to apply the techniques to the evaluation of SISs. Each Part expects the User to be familiar with the methodology and suggests that the User obtain additional information and resources beyond that contained in the technical report. The technical report was issued in draft in 1998 and should be released as final in 2000.
Simplified Equations and Fault Tree Analysis are two excellent techniques that can be used together to cost effectively evaluate SIS designs for SIL. Initial assessment of proposed options for input and output architectures can be performed quickly at various testing frequencies using Simplified Equations. When the overall SIS needs to be evaluated, Fault Tree Analysis is a proven technique that can model even the most complex logic relationships.
Acknowledgements
This paper was presented at Interkama, Dusseldorf, Germany, October 1999.
References
- "Application of Safety Instrumented Systems for the Process Industries," ANSI/ISA-S84.01-1996, ISA, Research Triangle Park, NC, 1996.
- "Process Safety Management of Highly Hazardous Chemicals; Explosives and Blasting Agents," 29 CFR Part 1910, OSHA, Washington, 1992.
- "Risk Management Programs for Chemical Accidental Release Prevention," 40 CFR Part 68, EPA, Washington, 1996.
- IEC 61508, 65A/255/CDV, "Functional safety of electrical/electronic/programmable electronic safety related systems," Parts 1, 3, 4, and 5, International Electrotechnical Commission, Final Standard, December 1998.
- IEC 61508, 65A/255/CDV, "Functional safety of electrical/electronic/programmable electronic safety related systems," Parts 2, 6, and 7, International Electrotechnical Commission, Final Draft International Standard, January 1999.
- Summers, A.E., "Techniques for assigning a target safety integrity level," ISA Transactions, 37, pp. 95-104, 1998.
- "Safety Instrumented Systems (SIS)—Safety Integrity Level (SIL) Evaluation Techniques, Part 1: Introduction," ISA dTR84.0.02, Draft, Version 4, March 1998.
- "Safety Instrumented Systems (SIS)—Safety Integrity Level (SIL) Evaluation Techniques, Part 2: Determining the SIL of a SIS via Simplified Equations," ISA dTR84.0.02, Draft, Version 4, March 1998.
- "Safety Instrumented Systems (SIS)—Safety Integrity Level (SIL) Evaluation Techniques, Part 3: Determining the SIL of a SIS via Fault Tree Analysis," ISA dTR84.0.02, Draft, Version 3, March 1998.
- "Safety Instrumented Systems (SIS)—Safety Integrity Level (SIL) Evaluation Techniques, Part 4: Determining the SIL of a SIS via Markov Analysis," ISA dTR84.0.02, Draft, Version 4, March 1998.
- "Safety Instrumented Systems (SIS)—Safety Integrity Level (SIL) Evaluation Techniques, Part 5: Determining the PFD of SIS Logic Solvers via Markov Analysis," ISA dTR84.0.02, Draft, Version 4, April 1998.
- "OREDA: Offshore Reliability Data Handbook," 3rd Edition, Det Norske Veritas Industri Norge as DNV Technica, Norway, 1997.
- "Guidelines for Process Equipment Reliability Data," Center for Chemical Process Safety of the American Institute of Chemical Engineers, NY, NY, 1989.
- "Non-Electronic Parts Reliability Data," Reliability Analysis Center, Rome, NY, 1995.
- Summers, Angela E., "Common Cause and Common Sense, Designing Failure Out of Your Safety Instrumented Systems (SIS)," ISA Transactions, 38, 291-299, 1999.


